
In my previous post, I talked about neutrino detection, and about the Kaggle competition IceCube – Neutrinos in Deep Ice, which challenged participants to reconstruct the direction of neutrinos from data on Cherenkov radiation given off by charged particles created by neutrino interactions in the ice at the South Pole.
As I mentioned, the contest was posed as a machine learning challenge, but I wondered how well it could be addressed by simpler models motivated by the physics of Cherenkov radiation.
Simple Models
In the simplest case, a muon travels in a straight line through the 1 cubic kilometer of ice in the IceCube Observatory, and its Cherenkov radiation is observed by multiple detectors.
As a first baseline, I constructed geometric models which assumed that the detections would be clustered around the path of the lepton, and simply fit a straight line to the actual detection points. My first models ignored both the time and energy of the detections, so they could not distinguish between leptons traveling in one direction or the opposite direction. Later, I incorporated timing.
I also constructed a physical model based on the geometry of Cherenkov radiation. In this model, I assumed a particular track (direction vector and offset perpendicular to the direction), and calculated the time when a photon of Cherenkov radiation would reach a given detector. I then constructed a quadratic loss function by comparing the differences in the observed and predicted times, and found the best direction and offset by minimizing this loss function. Even this physical model throws away lots of information. It still ignores the detected energy as well as the fact that the light flux drops off based on the square of the distance between the emission and detection points.
None of these models used machine learning and none required training. The closest I got to machine learning was that I used the sklearn TruncatedSVD function to perform the linear fits, and the TensorFlow function minimization routines to find the best fit direction for the emission model.
Results
To test these models, we run them on a subset of the labeled (training) data and measure the angle between the given direction and the one predicted by the model (which runs from 0 to pi). Here are some sample results from the linear fits to 2000 events
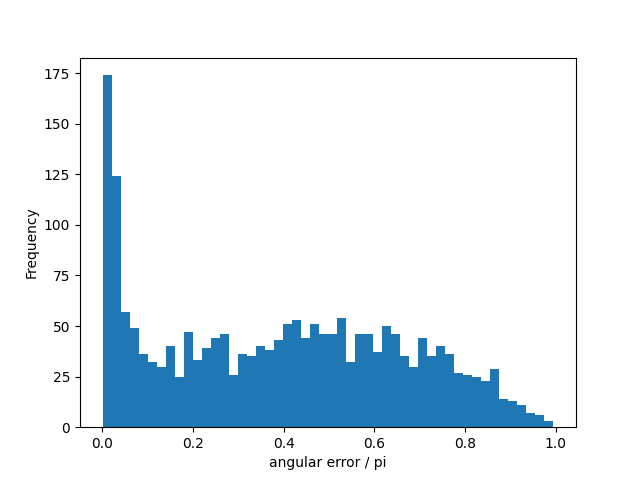
There is a peak near zero, and then a broad distribution. In fact, that broad distribution looks suspiciously like sine wave, which is what you expect for a completely random angular offset (where the largest contribution to the area comes from the ‘equator’ at /2). Fitting a sine wave to the distribution above , we see
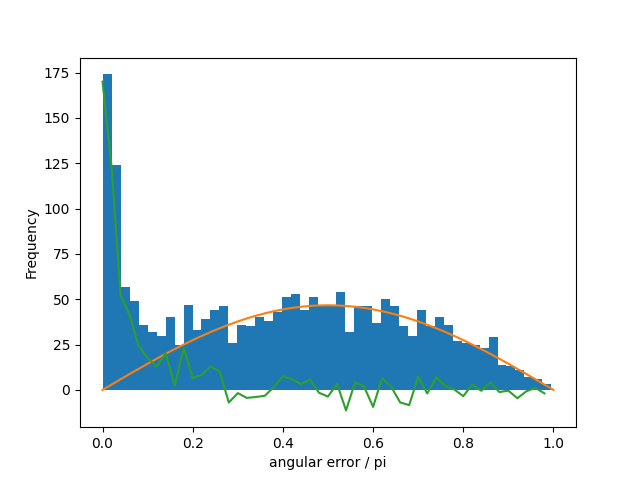
where the orange curve is the sine wave and the green is the residual after subtracting the best fit sine wave.
This means our model is doing reasonably well for one subset of the events but failing for the rest. Comparing areas, we estimate that 20% of the events are well fit (error < or , but with a mean of ), 75% are consistent with the estimated direction being random, with the remaining 5% possibly belonging to a slight excess over random between and . Note that random distribution of errors doesn’t mean that the given directions are random, just that the simple linear models can’t infer the direction from the data.
Searching the contest discussion board, I found that I was not alone in this observation1. The nature of the events which are not well-fit by the linear model is unclear. One of the participants in the discussion suggested that the events which were well-fit by a linear model are muon tracks, while the rest are cascade events where a charged particle loses most of its energy within the detector. Cascade events are known to be more spherical, and more difficult to reconstruct, though CNN (Convolutional Neural Network) models have had some success. However, there are other possible explanations for at least some of these events (e.g. coincident events per Aartsen et al., “Improvement in Fast Particle Track Reconstruction with Robust Statistics.”)
Note: while I had originally hoped that physics would help give me better models, this analysis is based solely on error analysis and statistics. They suggest that taking a scientific approach to technical problems (i.e. data science) has value, but don’t indicate one way or another whether knowledge of physics was helpful to reconstructing the direction of neutrino sources.
Evaluation
The Kaggle contest was evaluated based on the mean angular error. For the random distribution, that is or . As long as a fraction of events are no better than random, even reducing the mean error of the other of events which are well-modeled to zero, the best we could do is
where is the fraction of events for which we do no better than random. With , that would be roughly 1.2 radians, or almost
In fact, the mean error for the winning entry was 0.96 radians or . For the simple model where the predicted angle is no better than random for fraction of events, this implies , so a majority of events would still be poorly modeled. This estimate is a lower limit; if the leading entries were able to model some fraction of complex events with better than random errors, then the fraction of random errors would have to be even larger to be consistent with the reported scores.
At face value, only modeling 40% of results well doesn’t seem like a major success. However, that might simply reflect the difficulty of the task.
Conclusions
Framing the Contest
At first, I thought it was strange that the contest organizers had chosen mean angular error as a criteria for the Kaggle competition. After all, if your goal is to pinpoint the origin of an event so as to point optical observatories at the same event, you don’t need to get a good direction for every single event; as long as you know which events yield a reliable direction, you can follow up only those events. However, if Kaggle had judged success based some combination of the accuracy of the best reconstructions, together with how many directions were measured with that accuracy, it would have encouraged contestants to focus their effort on the simplest events which could be recovered with high accuracy. Using mean angular error meant that you had to do better than random on events which were difficult to localize.
Still, it is interesting that the sponsors didn’t say anything explicitly about different classes of events, and that the example event they used to illustrate the experimental data had a single linear track (at least ignoring the more doubtful auxiliary detections). Describing and illustrating the more complex classes of events would also have encouraged contestants to pay attention to those more complex cases.
Furthermore, one can easily imagine that fitting different models to each class of events might be more productive than trying to build a single model to handle all events – would more information have led to better results? Finally, understanding the different classes of events might have its own benefits; it could illuminate directions for future research, or indicate that for some class of events, further progress was unlikely.
The broader question of how to design a Kaggle contest to achieve research goals is fascinating, and I may comment on it in a future post.
Value of Science
What about my original question about which would matter more, machine learning or physics?
On the one hand, given that
- the mean angular error depends more on how many events you can model well, and
- only a limited fraction of those events are easily modeled with simple mathematical or physical models,
machine learning seems to have been essential to success in the contest.
On the other hand, it is unclear how many people appreciated the different classes of event and the error distribution for each one, and whether that could have led to better results. This is less an argument in favor of physics, but would reflect value in taking a scientific approach to data modeling. However, unless someone else actually demonstrates that this knowledge can lead to better results, it is difficult to draw a final conclusion from this contest.
- One of the participants in the discussion of the error distribution placed 8th overall in the contest. ↩︎

Leave a Reply
You must be logged in to post a comment.